IOA Season Recap
As the cold, rainy season has come to a close and we welcome the 90+ degree Fahrenheit days (in Davis) I thought I’d share some “end of season” stats. For our avid readers, you may recall last year’s blog about the OWCN’s Individual Oiled Animal (IOA) Program and the influx of patients admitted to our member organizations during the winter months. If you do not have the memory of an albatross, much like me, here’s a quick refresher.
The IOA program was created to prepare OWCN Member Organizations for spill response by utilization of our animal care protocols while rehabilitating animals contaminated with unidentified sources of petroleum. With the implementation of OWRMD we are able to monitor the number of oiled animals admitted in real time, creating an “early alert system” in case of an unreported or undetected oil spill. Oil samples collected when these animals are processed can be used to better characterize environmental contamination from unknown sources of petroleum through chemical fingerprinting performed at the Office of Spill Prevention and Response (OSPR) Petroleum Chemistry lab. The IOA program has allowed us to monitor trends in oiled birds dating back to the 1990s. One of the interesting things we’ve found is that there is actually an “oiled bird season” in California from December to March, largely due to natural seep. A study published by our colleague at OSPR, Laird Henkel, and fearless leader, Mike Ziccardi, found evidence that rainfall and swell patterns may be related to the observed seasonality.
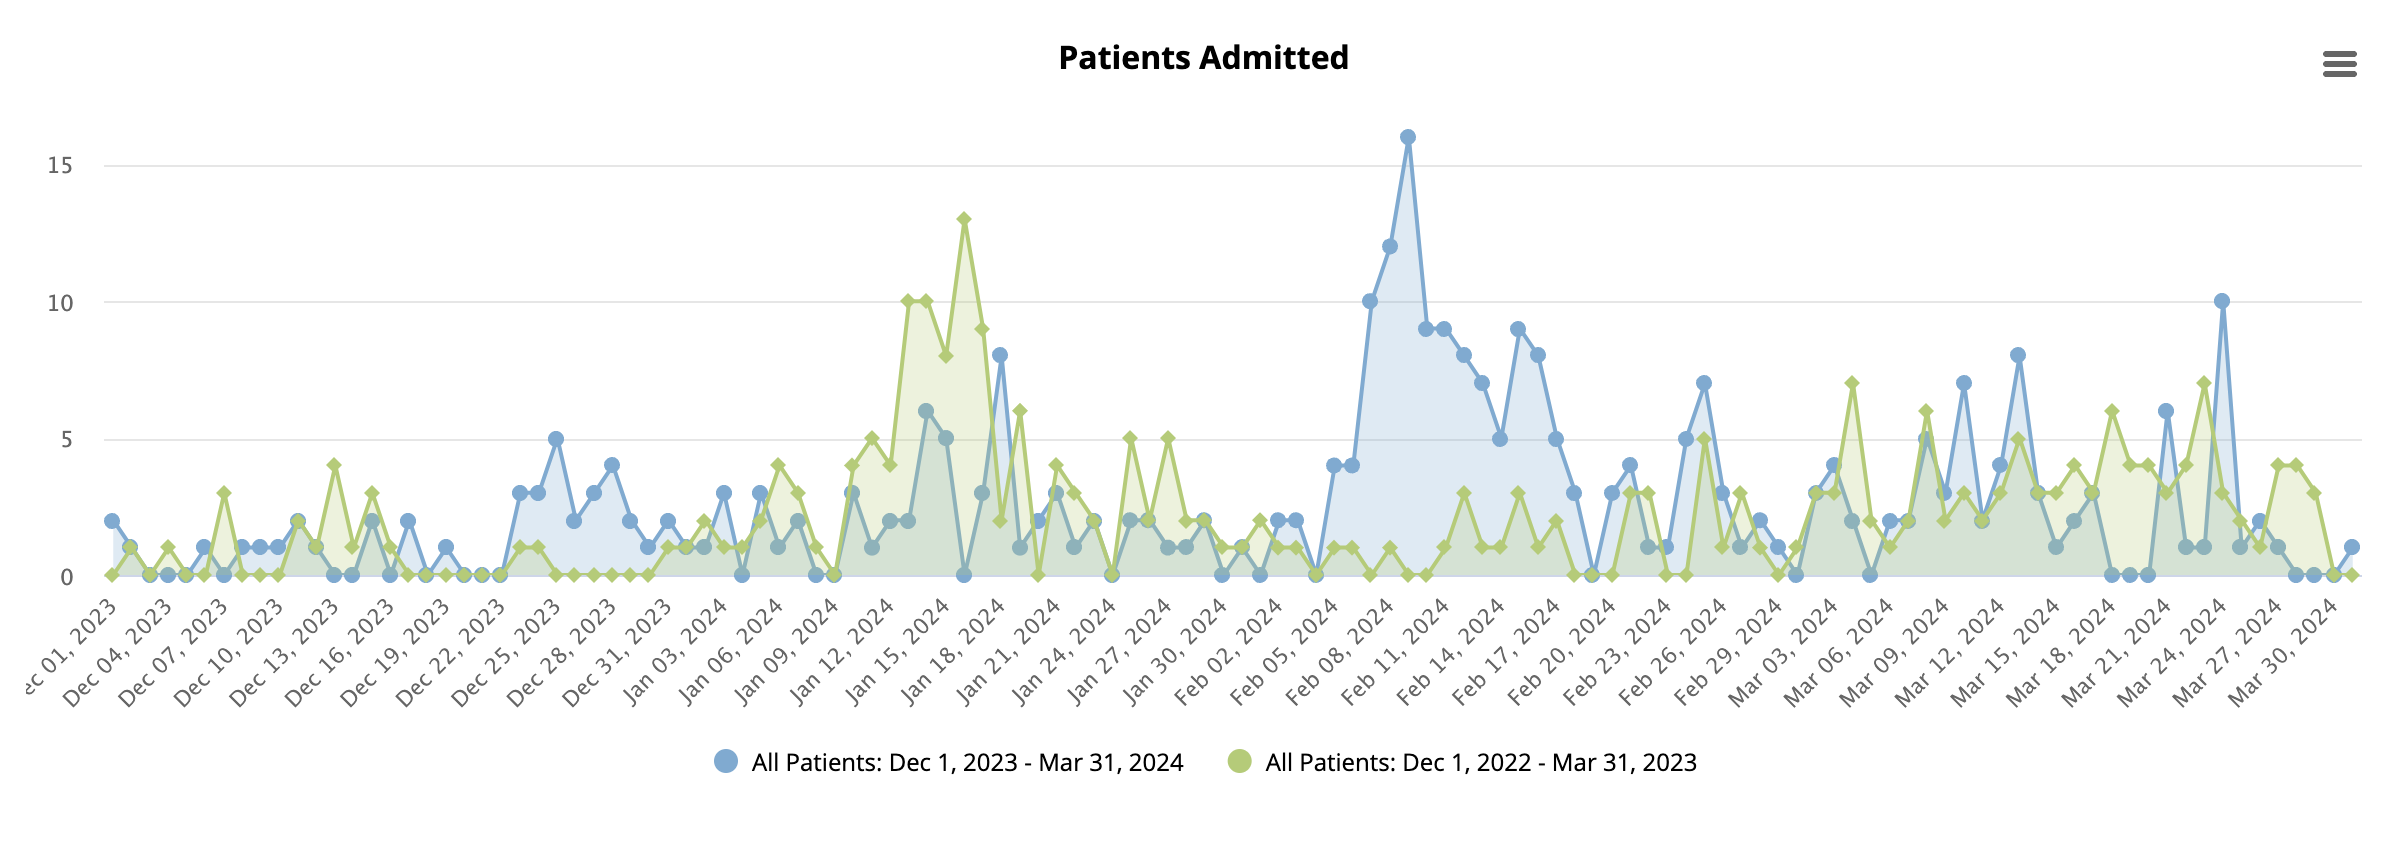
This year, another wet winter brought another unprecedented season of IOA’s from natural seeps! Since December 1, 2023 over 420 oiled animals have been to our member organizations (up 5% from the same time period last year). Three hundred and fifteen of those animals were admitted between December 1, 2023 – March 31, 2024 (up 15% from the same time period last year). Nearly half of those were admitted in February which happened to be one of the wettest February’s since 1878 with some coastal areas reporting over 20 inches in rainfall!
Common murres were the most commonly affected species, followed by western grebes, brown pelicans, Brandt's cormorants and red-throated loons. The vast majority of birds were collected south of Point Conception which is consistent with the areas with the most active natural seeps.

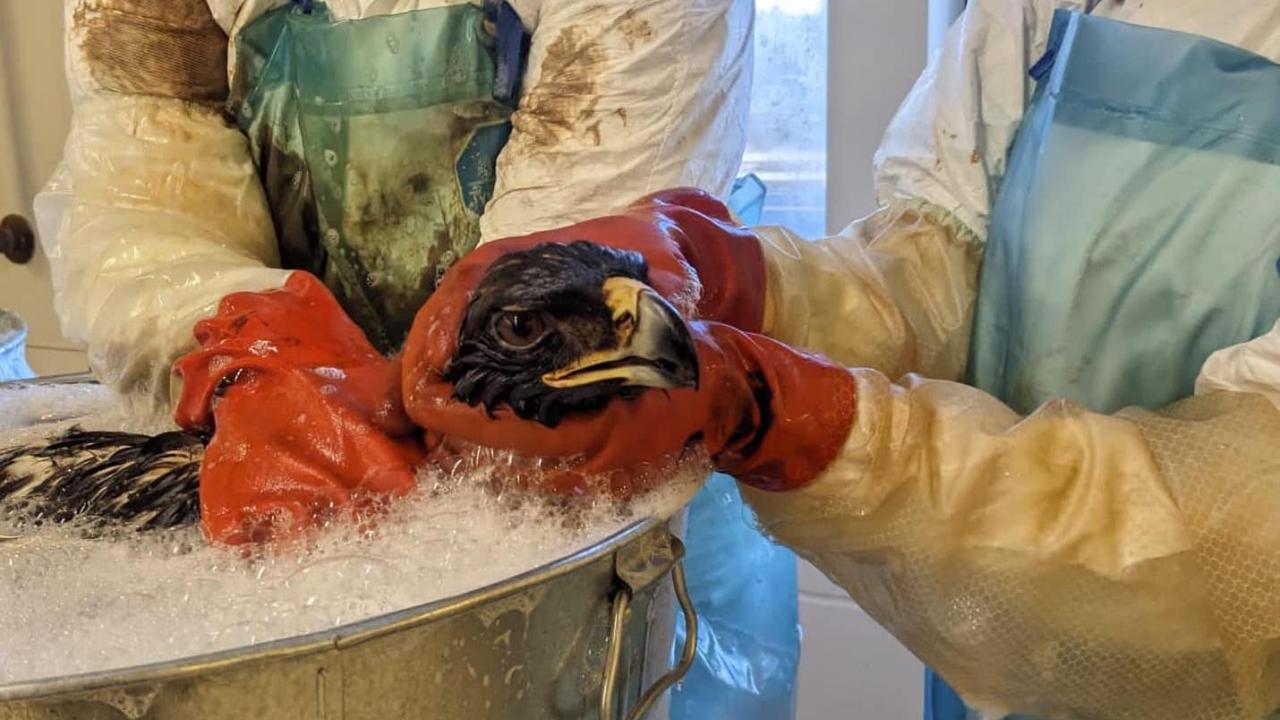
I’ve said it before and I’ll say it again - I’d like to extend a special thank you to our hard-working member organizations who have been providing exceptional care for this influx of oiled birds in addition to their regular patient loads. We are incredibly thankful for your continued commitment to oiled wildlife during spills and non-spill times!